
Managing
technical uncertainties
Statistics,
RAMS
& Quality Management
Search
this site  Search
this site Search
this site
|
|
|
Weibull
Analysis
Weibull
analysis is based on the so
called Weibull distribution (from now on called "the Weibull"). The
Weibull is used for modeling
failure rate versus time. It is interesting that in this context,
the Weibull serves only as a heuristic distribution function without
any mathematical foundation. Nevertheless, the Weibull has proved
to be useful in practice because it can model failure
rate over time quite well.
Today, the name Weibull analysis is
used synonymously with the type of analysis described here, regardless
of the distribution function actually used (e.g. the log-normal
distribution or the beta distribution).
Originally, Weibull analysis used to
be a purely graphical method for
determining failure rate over time, because at that time there wasn't
any software available.
An essential feature of Weibull analysis is the specific axis scaling
of the so called Weibull plots. This scaling ensures that
cumulative distribution functions appear as a straight line, and
not as
an S-curve. Straight lines facilitate assessment by human eye. Today
there are plots available not only for the Weibull, but also for other
distribution functions.
If the failure data build a straight
line (at least approximately), then the
underlying distribution function of the data does follow the
distribution
function of which the Weibull plot is made.
The parameters of the distribution
function, namely the
average life and possibly a further parameter ("shape"),
can be determined directly from the straight line (by human expert eye).
Despite today's availability of
specific Weibull software, experts won't set aside human eye assessment. Therefore, today's
Weibull software still provide these "old fashioned" graphical Weibull
plots.
The most important distribution
function in Weibull analysis is the Weibull
distribution. This, as well as Weibull analysis in general, goes back
to Mr.
Waloddi Weibull.
The two parameters of the Weibull
distribution are:
1. Characteristic life (statistically
just an average),
2. Shape factor
As indicated above, the Weibull
distribution is a heuristic engineering tool,
because it can model failure rate over time quite well. Therefore it is
not a mathematically established
distribution
function. Changing failure rates over time are usually a consequence of
wear and changing operating conditions.
The characteristic life is the
average life time of the items of
the population until they fail.
The shape tells us whether all items
share
approximately the same life time (and therefore fail within a small
time
window), or whether their life times differ
significantly.
The latter case would be unfavorable
from a maintenance viewpoint, since
individual failures would be difficult to forecast.
It is a unique characteristic of
Weibull analysis that the failure data must be entered into a specially
scaled coordinate system (Weibull plot), so
that the data can build a straight line. In
addition, there are specific rules how the data is to be entered. Then,
both parameters (characteristic life and shape) can be read directly
from the straight line by human eye.
Even if the data don't make a
straight line, experts can make particular conclusions:
- changing operating conditions at a specific point in time in the
past
- two or more (instead of one) sub-population (e.g. items coming
from two different production lines)
- ...
The following figure shows a
completed Weibull plot:
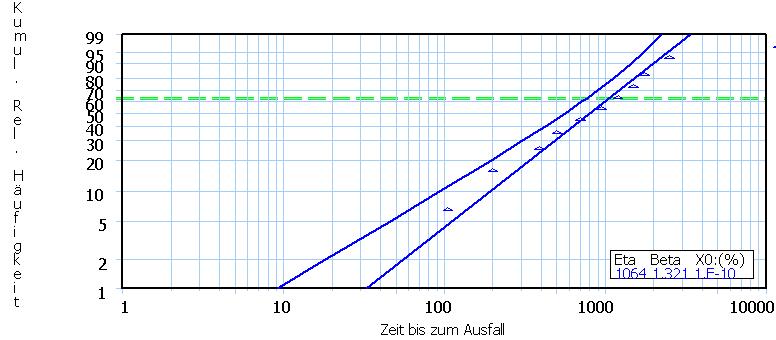 Triangle: A data point (a failure).
Left perpendicular axis: Relative
failure frequency in % (double-logarithmic scale). For example,
99 means that 99% of the population have failed.
Horizontal axis: Time (logarithmic
scale)
Triangle: A data point (a failure).
Left perpendicular axis: Relative
failure frequency in % (double-logarithmic scale). For example,
99 means that 99% of the population have failed.
Horizontal axis: Time (logarithmic
scale).
The placement of the triangles
follows dedicated statistical procedures and is therefore beyond this
introduction.
The plot shows 10 data points
(triangles) in total, the last being close to 100%.
Therefore the total population consisted of 10 items accordingly.
Example:
Leftmost triangle: The first failure
happened after a little more than 100 hours; the
cumulative incidence was registered not at 10% (because 1 out of 10 =
10%), but statistically
correct at about 7%.
The blue straight line is calculated
by the Weibull software, however, it is approximately what would be
concluded by human expert eye. The blue curve on the left is the
statistical left
90% confidence bound of the straight line, i.e., the true straight line
lies
pretty sure on the right of this curve.
The intersection of the straight line
with the green dashed line (at 63%) yields the characteristic life Eta,
here a little more than 1000 hours.
The shape Beta (1,321) can not be
derived
from this Weibull plot because, fore the sake of simplicity,
a few plot elements (the so called "pole") have been omitted. Complete
Weibull plots however would also allow the reading of Beta.
Privacy Policy