
Managing
technical uncertainties
Statistics,
RAMS
& Quality Management
Search
this site  Search
this site Search
this site
|
|
|
Reliability
Block Diagrams
Reliability
Block Diagrams are useful
for visualizing and analyzing complex systems. The system is broken
down into functional blocks. Functional
blocks then are connected with arrows in order to depict a kind of
"functional flow".
Complex systems have at least one of the following
characteristics:
- Parallel branches (redundancy)
- Fault tolerance
- Network structure (e.g. production line)
- Dedicated maintenance philosophy (e.g. repair of block A affects
block B)
The functional blocks, start and end point are connected with
"functional flow" arrows according to the system architecture. Reliability Block Diagram
As long as there is at least one
uninterrupted connection between start
and end (a so called path set, or success path), the system is
considered functional.
A good example may be a twin engine aircraft, which will be also used
in the Markov paragraph in order to demonstrate the differences between
Reliability Block Diagram and Markov.
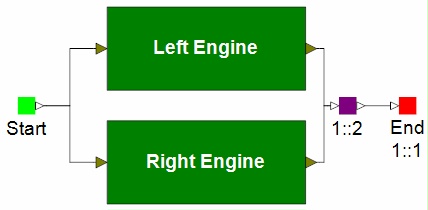
Twin engine aircraft can safely fly with only one engine. However,
if one engine fails, the aircraft must fly directly to the nearest
eligible alternate airport.
The "1::2" below the node means that at
least one out of two incoming paths must be functional in order
to keep the system functional. In this example, each of the two paths
consists of one engine.
Depending on the capability of the Reliability Block Diagram software,
many system parameters can be calculated, for example:
- Failure rate, MTBF
- Reliability R
- Availability A
- Repair cost, repair time
- Optimal maintenance interval (depending on criteria)
- Optimal number of spares (depending on criteria)
The reason why we use the twin engine
example is to show the limitations of Reliability Block Diagrams in
comparison to Markov analysis.
In RBD, the aircraft is considered to have failed as soon as both
engines fail. In practice however this is not necessarily the case,
because the aircraft can fly safely even with both engines failed ...
at least for 10 minutes. This would probably be enough time for the
crew to restart one of the engines in order to make it to the nearest
alternate airport.
There is a further limitation: With one engine failed, the remaining
engine must work harder in order to keep the aircraft airborne. This in
turn would cause a higher failure rate for the remaining engine.
Reliability Block Diagram cannot handle this, but Markov analysis can.
Previous
Topic
Next Topic
Privacy Policy